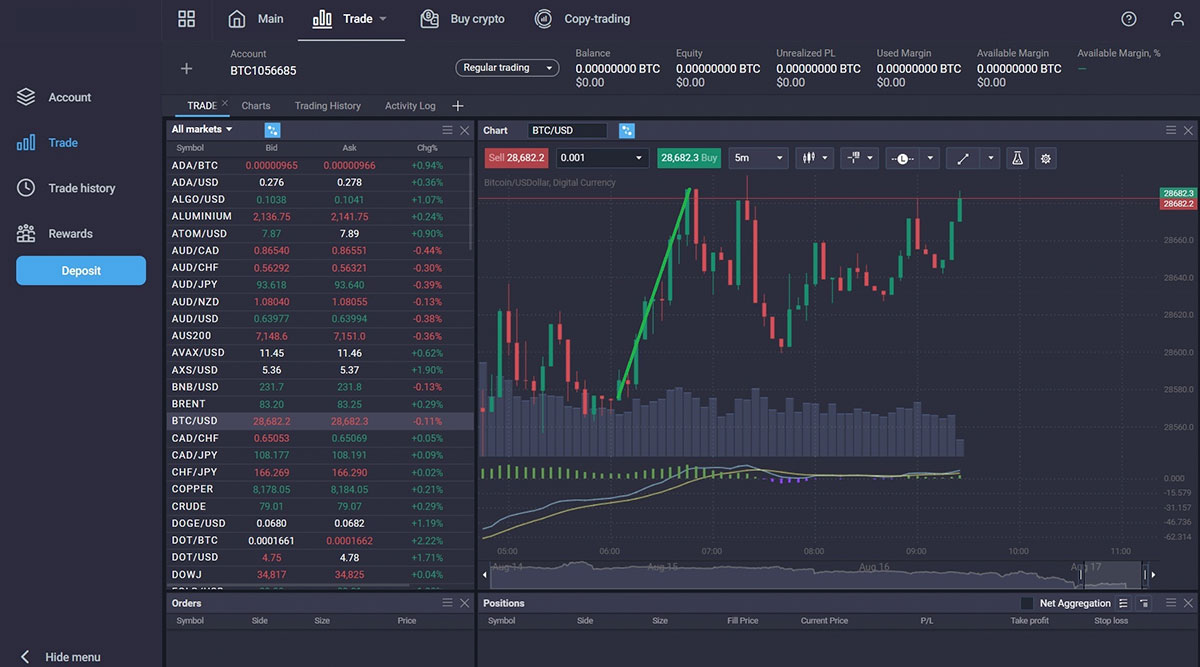
While it's often claimed that markets are unpredictable, there's a method to the madness. Certain price chart patterns like the double top pattern offer a systematic way to read market movements, acting as historical footprints that signal future trends. Recognizing such patterns can greatly benefit traders, particularly in the volatile realm of margin trading where capitalizing on both upward and downward trends can yield significant returns.
A Primer on Technical Analysis: The Building Blocks
Before diving into the specifics of the double top pattern, it’s essential to have a solid grasp of technical analysis. Technical analysis is the science and art of forecasting market trends through the study and interpretation of historical price data, usually in the form of price charts. The methodology primarily operates under the basic economic principles of supply and demand.
Understanding Chart Patterns vs. Technical Indicators
Chart patterns are different from technical indicators, though both are crucial tools in technical analysis. Chart patterns like the double top are formed through the plotting of price points over time, which can be represented through candlesticks or line graphs. On the other hand, technical indicators involve mathematical formulas translated into graphical data, often overlaid on the price chart.
Support and Resistance: The Fundamental Pillars
In technical analysis, price movements gravitate around two essential points: support and resistance levels. The support level serves as a safety net, where buying interest is significantly strong and surpasses the selling pressure, halting the price from falling further. On the flip side, the resistance level acts as a ceiling, halting the price from rising any further due to increased selling pressure.
A well-established support or resistance level is often validated after it has been 'tested' multiple times. Contrary to this, the validation is often bypassed when specific chart patterns like the double top form.
Decoding the Double Top Pattern: Anatomy and Nuances
What Defines a Double Top?
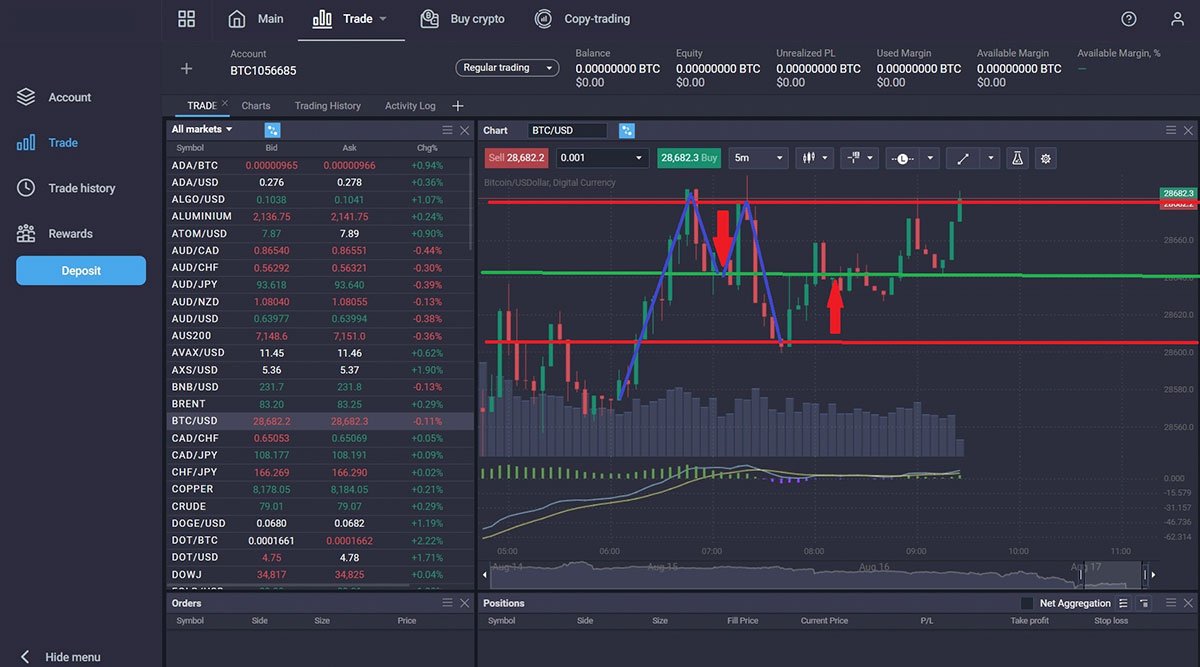
In essence, a double top pattern is a bearish reversal chart pattern characterized by two consecutive peaks. This pattern occurs after a strong uptrend and signals the impending reversal to a downtrend.
Key Features of the Double Top Pattern
- Preceding Uptrend: The pattern is always preceded by an upward movement.
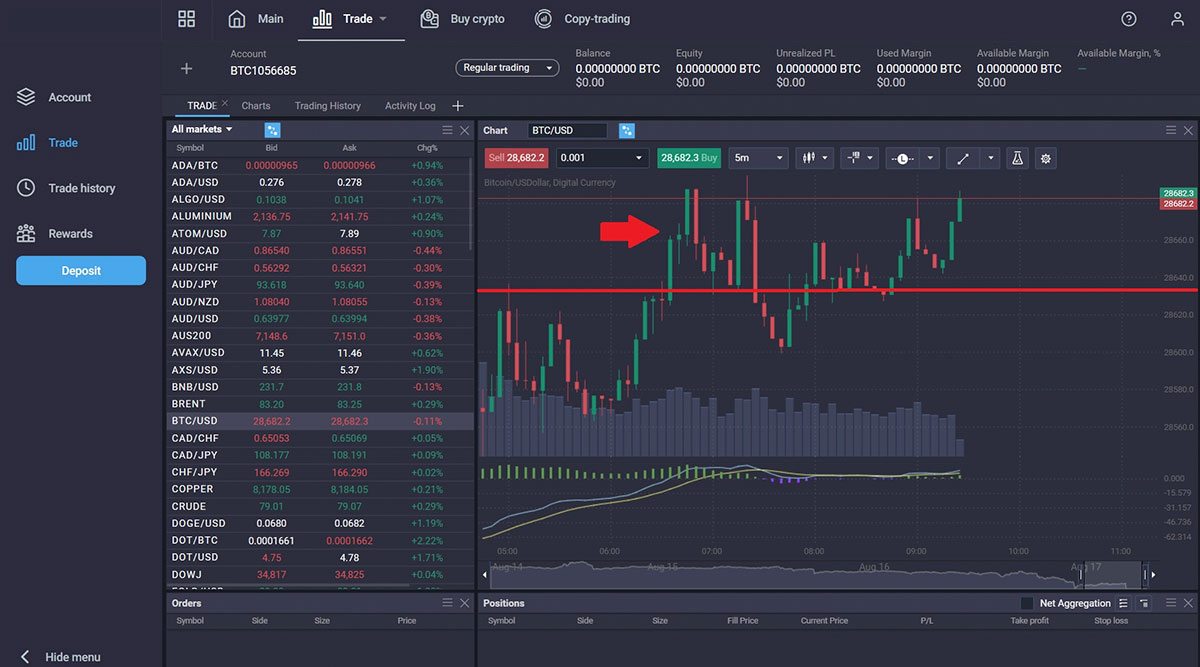
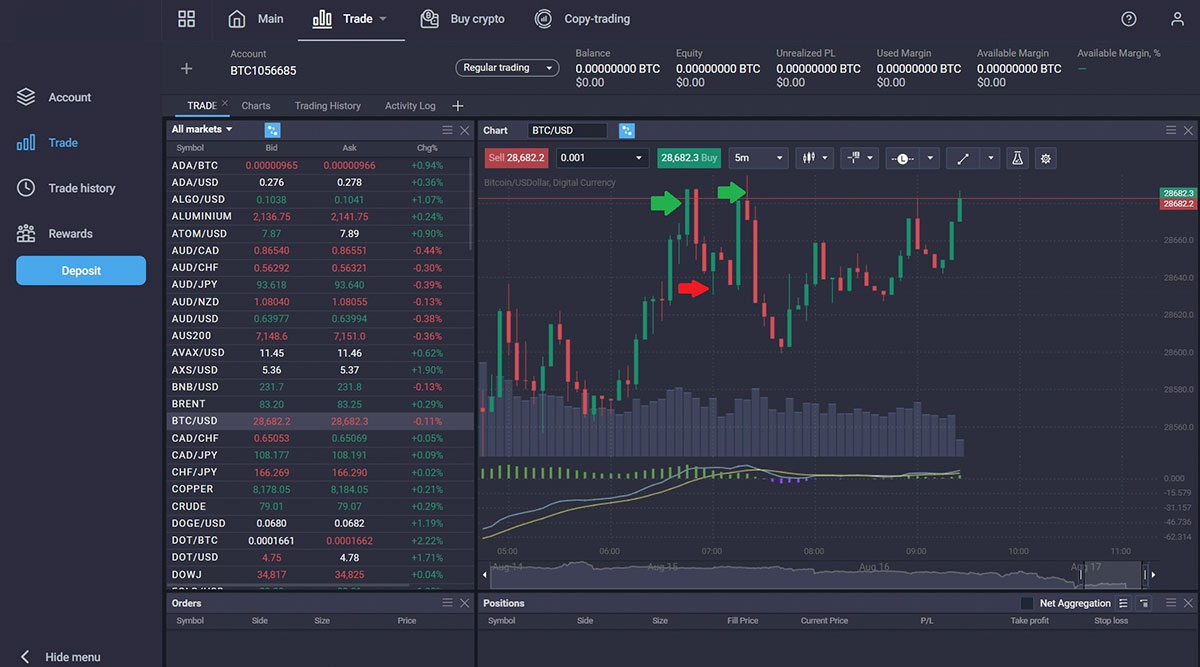
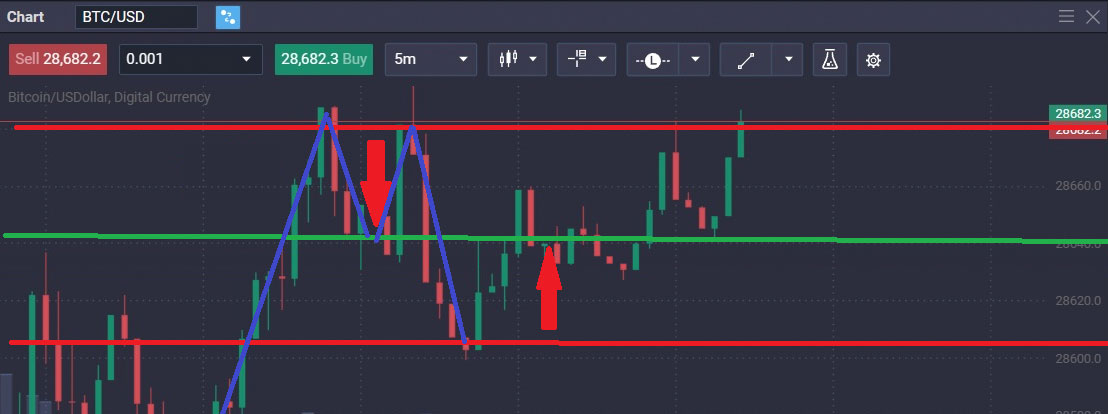
- Resistance Testing: Both peaks of the double top pattern occur near the same resistance level.
- The Neckline: The intervening trough between the two peaks creates a 'neckline,' which acts as the support level.
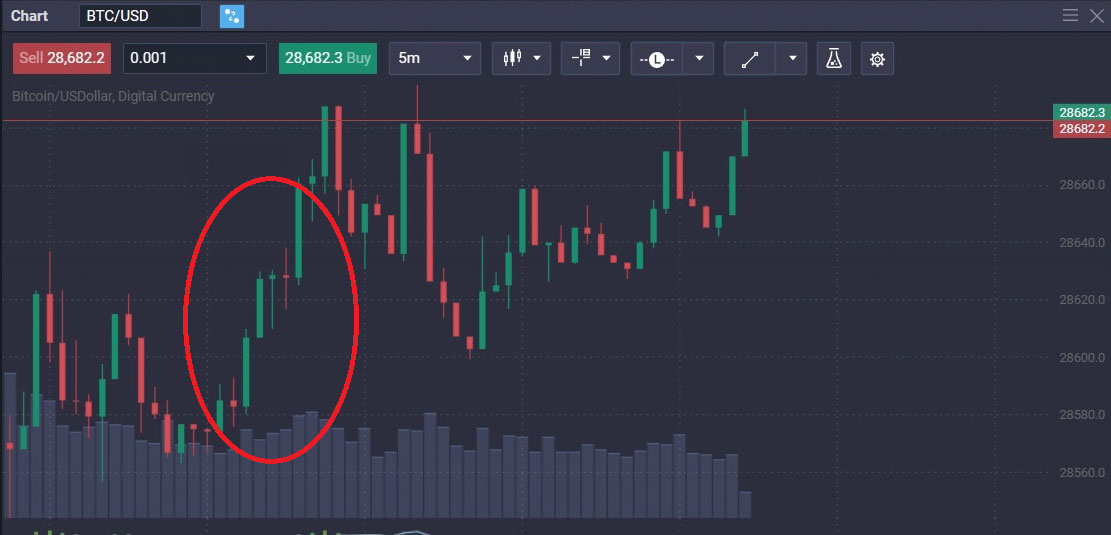
- Volume Dynamics: The pattern is often accompanied by a decline in volume, adding confirmation to an impending reversal.
Stages of Formation
- Initial Uptrend: The first requisite for a double top formation is an obvious uptrend.
- First Peak Formation: The uptrend slows down, forming the first peak as selling pressure increases.
- Temporary Pullback: A temporary price pullback occurs, which may test support levels.
- Second Peak Formation: Another run towards the resistance level creates the second peak, which often fails to surpass the first peak due to a loss of momentum.
- Completion: The pattern is considered complete when the price breaks below the neckline support, often accompanied by an increase in volume.
Practical Applications: How to Trade the Double Top Pattern
Strategic Entry and Exit
It's crucial to note that while the pattern’s formation might be underway, one should wait for confirmation before entering a trade. The pattern is fully confirmed when the price breaks below the neckline support level. Once the pattern is confirmed, one could consider taking a short position.
Risk Management: Stop-Loss and Target Prices
The importance of setting up a stop-loss can’t be overstated. A well-placed stop-loss will limit potential losses if the pattern proves to be false. Ideally, the stop-loss should be placed just above the neckline or the last highest point, depending on your risk tolerance.
Common Pitfalls and Precautions
Mistaking Similar Patterns
Many traders confuse the double top pattern with other patterns like the 'Head and Shoulders.' It's essential to wait for complete formation and confirmation to avoid such errors.
Double Top vs. Double Bottom
While the double top pattern indicates a reversal from a bullish to a bearish trend, its counterpoint, the double bottom, indicates a bearish to bullish reversal, forming a ‘W’ shape.
Conclusion: The Versatility of the Double Top
The double top pattern holds a significant place in a trader’s toolkit. Its straightforward identification and historical reliability make it an essential pattern for traders ranging from novices to experts. Like any tool, its effectiveness is magnified when used wisely and in conjunction with other forms of analysis.
FAQ: Quick Reference Guide
- Is the double top pattern bullish or bearish? The double top pattern is bearish.
- What occurs after a double top pattern? A trend reversal from bullish to bearish is anticipated.
- How reliable is the double top pattern? While no pattern offers a 100% guarantee, the double top is widely regarded as one of the more reliable chart patterns, especially when confirmed by other indicators and volume analysis.