In the intricate world of financial trading, one can easily get overwhelmed by the enormous amounts of data flooding the markets daily. Technical analysis offers a structured approach to decipher this data and anticipate price trends. Within technical analysis, indicators play a vital role, acting as the lens through which traders view and interpret market behavior.
Understanding Technical Analysis
Technical analysis isn't just about graphs and numbers. It's about understanding the psychology of the market. Primarily used in the forex, stocks, commodities, cryptocurrency, and indices sectors, it deciphers price action through various trade signals. To embark on this journey, one needs a reliable trading platform, such as MetaTrader 4, which offers a plethora of in-built indicators. Additionally, accessing historical data through platforms like Quandl or Yahoo Finance can also offer significant insights.
Decoding Trading Indicators
At their core, technical indicators are mathematical constructs that help in forecasting asset price direction based on historical data. They provide insights into potential overbought or oversold conditions, aiding traders in spotting profitable opportunities. Let's take a deeper look into how they operate.
Technical indicators don't function in isolation. They reflect the market's collective psychology, illustrating the relationship between current and historical prices. Paired with candlestick patterns, these indicators can form the foundation of a robust technical analysis strategy.
Classification of Technical Indicators
Technical indicators can be classified into two primary categories:
- Overlay Indicators: These are essentially visual tools where one trend is superimposed on another. The resultant visual representation, with distinct colors for different trends, offers quick insights.
- Oscillator Indicators: These measure the momentum of price changes over a specified period. Oscillators like moving averages provide insights into potential price highs based on historical data.
Within oscillator indicators, two subtypes are noteworthy:
- Leading Indicators: These anticipate future market conditions based on the current scenario. They're often juxtaposed with lagging indicators for enhanced insights.
- Lagging Indicators: These reflect historical data, and some of the prominent ones include Moving Average (MA), Exponential Moving Average (EMA), and Moving Average Convergence Divergence (MACD). Their primary utility lies in their ability to offer a clearer picture of market sentiment.
The 17 Most Coveted Trading Indicators
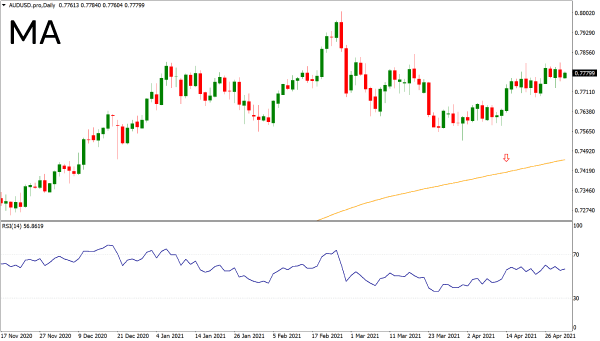
Moving Average (MA): Acts as a trendspotter, indicating potential upward or downward trends based on short-term and long-term MAs.
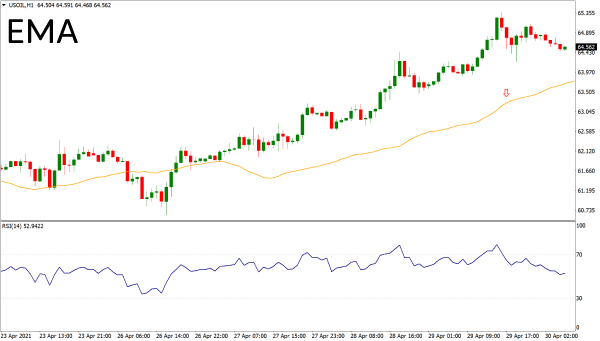
Exponential Moving Average (EMA): A nuanced version of MA, focusing on two time intervals for more precise value calculation.
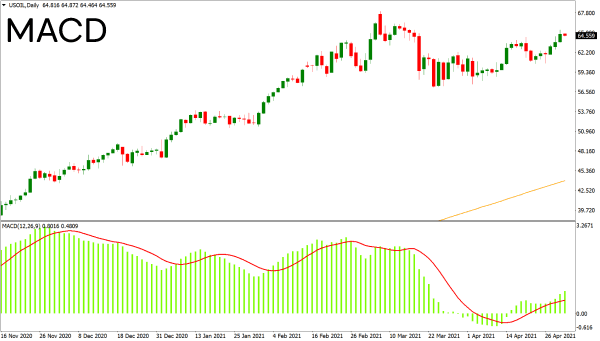
Moving Average Convergence Divergence (MACD): A momentum oscillator capturing the essence of two EMAs and their interactions.
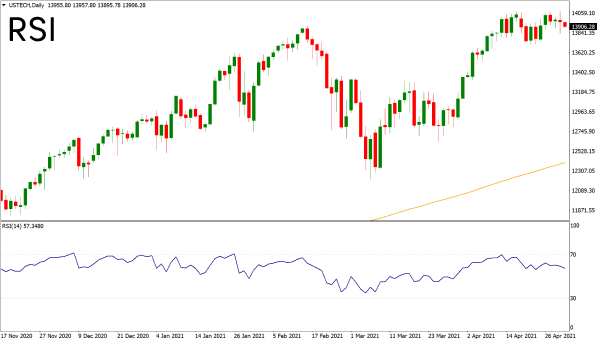
Relative Strength Index (RSI): Highlights the magnitude of recent gains versus losses, acting as a potent momentum tracker.
Percentage Price Oscillator (PPO): Offers insights into stock gains and their implications.
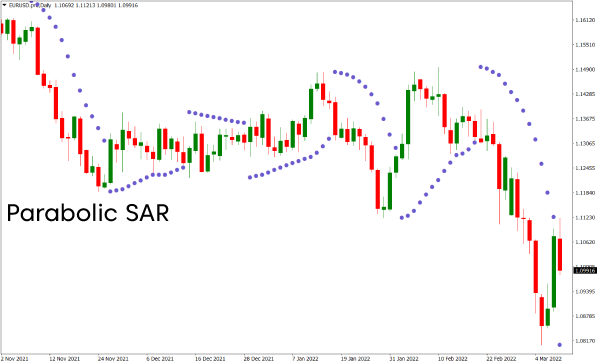
Parabolic SAR: Assists in ascertaining momentum shifts in prices, offering a refined approach compared to traditional moving averages.
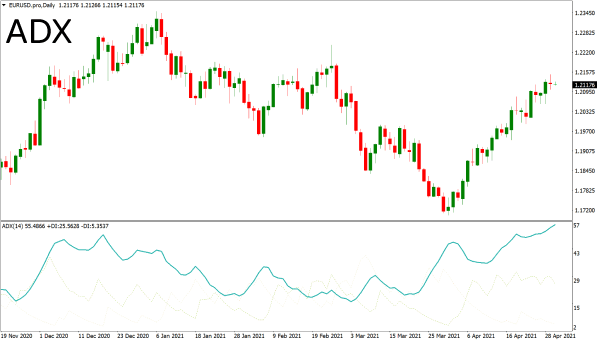
Average Directional Index (ADX): A trend determinant which measures the vigor of price shifts.
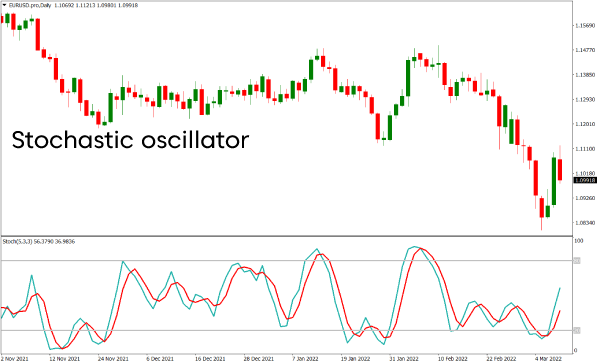
Stochastic Oscillator: A momentum tracker reflecting price movements towards their high or low points.
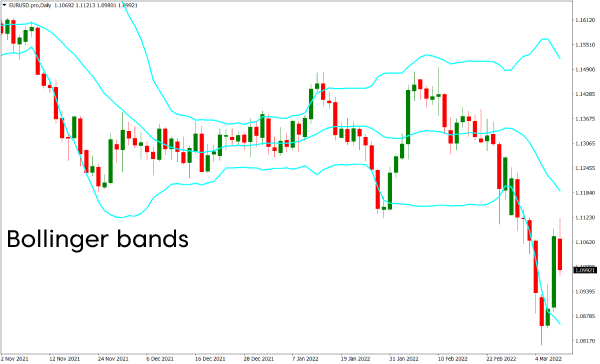
Bollinger Bands: Represents volatility levels, acting as a guide to anticipate potential price movements.
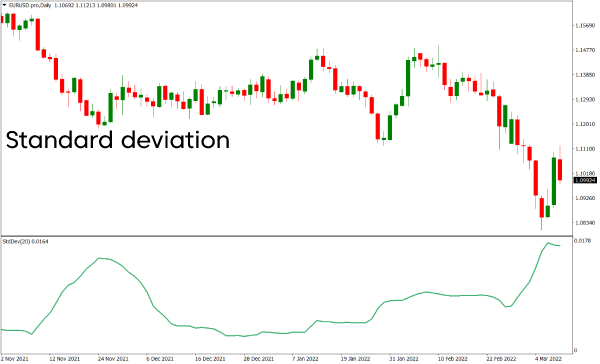
Standard Deviation: A volatility measure shedding light on day-to-day price fluctuations.
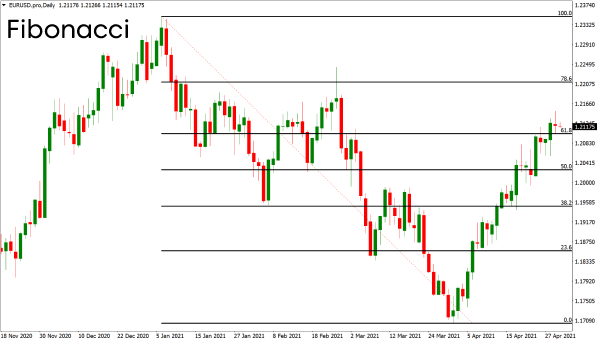
Fibonacci Retracement: Helps in spotting areas of intense buying pressure or potential price reversals.
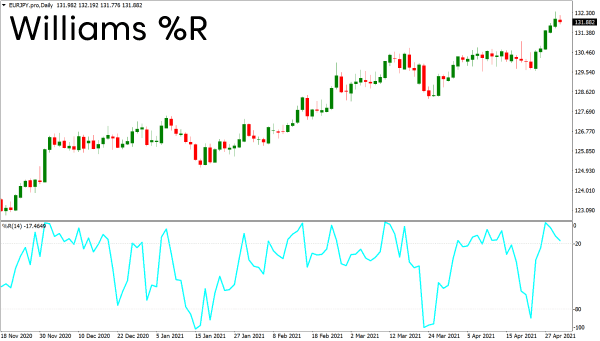
Williams Percent Range (%R): A volatility reflection tool, offering cues for trend reversals.
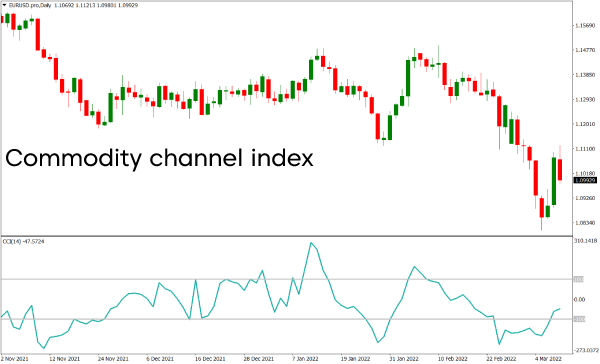
Commodity Channel Index (CCI): Deciphers dominant trends in commodity futures prices.
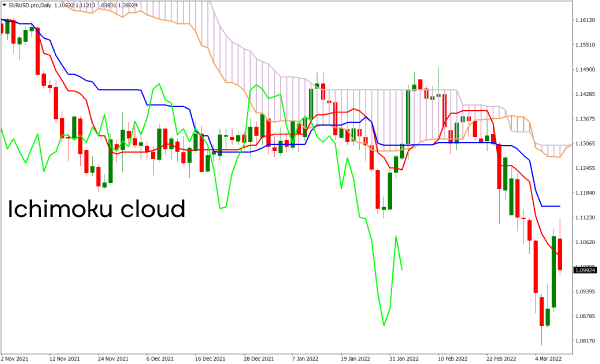
Ichimoku Cloud: Comprising four lines, it offers a detailed view of market trends and their potential shifts.
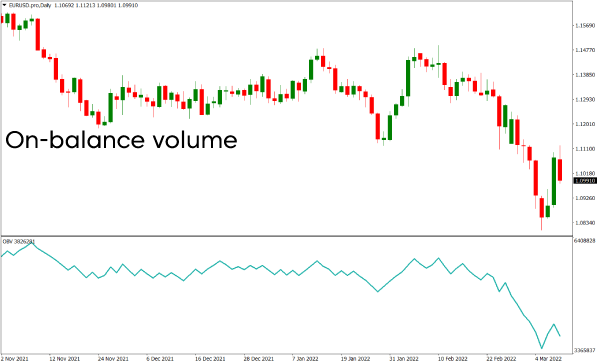
On-Balance Volume (OBV): A volume-centric tool capturing cumulative trading dynamics.
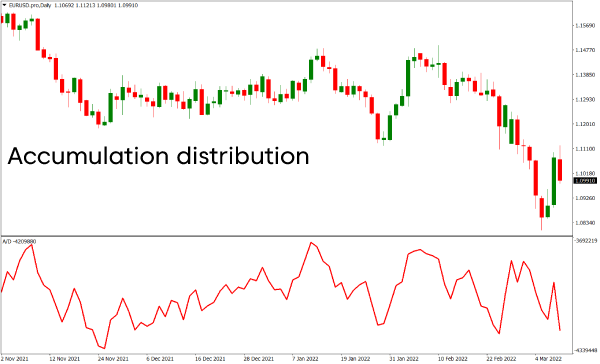
Accumulation/Distribution Line (A/D): A momentum gauge focusing on the volume-price relationship.
Aroon Oscillator: Measures trend momentum concerning price levels, aiding in spotting overbought or oversold scenarios.
While the world of technical indicators is vast and multi-faceted, understanding the core essence of each can make a world of difference to trading strategies. These tools, when combined with real-world insights and a nuanced understanding of market dynamics, can significantly enhance a trader's prowess and predictive capabilities.
Deciphering the World of Technical Indicators
When delving into the world of trading, both novices and seasoned traders often find themselves pondering about the best technical indicators to employ. These tools are pivotal for making informed decisions in the financial markets. However, it's crucial to understand the functionality of each indicator and how it aligns with your trading strategy.
The Starting Point
Moving Averages A common question for newcomers is: Which technical indicator should I begin with? A robust starting point is the Moving Average (MA), particularly the 50-day moving average. This is because the 50-day MA, especially when it's not excessively smoothed, offers an excellent balance between capturing the essence of the near-term price action and filtering out short-term market noise.
When a price crosses above its 50-day MA, it often signifies bullish momentum, suggesting a possible buying opportunity. Conversely, a price moving below the 50-day MA may be indicative of bearish sentiment, signaling a potential selling opportunity. This methodology can be applied even to short-term charts as these MAs serve as pivotal support and resistance levels, reflecting broader market trends.
Tools of the Trade
Popular Technical Indicators Different trading scenarios call for different technical tools. Here are a few:
- Day Trading: Key indicators include the Relative Strength Index (RSI), Williams Percent Range, and the Moving Average Convergence Divergence (MACD). They can pinpoint overbought or oversold market conditions, helping traders anticipate potential price reversals.
- Forex Trading: The world of forex predominantly leans on the RSI, MACD, and Bollinger Bands. These tools offer insights into potential future price movements based on historical data.
To bolster trading decisions, forex traders often blend technical indicators with fundamental analysis. For instance, after identifying a potential trend using technical tools, a trader might validate this sentiment by analyzing fundamental factors, such as economic indicators or geopolitical news.
The Right Quantity
How Many Indicators Should You Use? The number of indicators to use largely hinges on individual trading style, strategy, and experience level. While indicators can provide invaluable insights, an over-saturation can muddy the waters, leading to indecision and potential missteps. Hence, clarity and simplicity are of paramount importance.
- Experience Level: Novices often lean on indicators for guidance, while seasoned traders might primarily rely on price action, using indicators sparingly for confirmation.
- Trading Horizon: Short-term traders, like scalpers operating on 5-minute charts, need to act swiftly, making an overload of indicators counterproductive. In contrast, long-term traders working with daily charts can afford a more in-depth analysis.
- Personal Preference: The ideal setup varies from trader to trader. Some might prefer a minimalist approach, with just the bare candlestick patterns, while others might feel at ease with multiple indicators at their disposal.
However, regardless of individual preferences, it's prudent to avoid redundancy. If multiple indicators convey similar insights, it's an indication to trim down.
For a structured approach, consider categorizing your indicators into:
- Trend Indicators (e.g., Moving Averages, Parabolic SAR) to detect market direction.
- Momentum Indicators (e.g., RSI, Stochastics) to gauge the strength behind price movements.
- Volume Indicators for understanding the depth of a particular price movement. It's essential to note that volume data in the forex market might be less reliable due to its decentralized nature.
- Volatility Indicators (e.g., Bollinger Bands, ATR) to understand market fluctuations and potential price breakouts.
In Conclusion
While technical indicators are powerful tools, it's imperative to combine them judiciously with other analytical methods. Ensure your strategy is aligned with your goals and continuously refine your approach as you gain more experience in the markets.