One helpful skill for traders is learning how to trade chart patterns. But what is chart pattern analysis and how reliable is it? Let’s explore the most common patterns recognized by technical traders and see if chart pattern trading is right for you. Before we get into it, pick a popular asset such as gold, and open a chart on another tab. An easy way to view live price charts on your browser is to click the button below. There is no funding or complicated registration required. Just enter your email to access the Exness Web Terminal on your browser without any download or installation needed.
Trade with Exness advantages
It’s important to understand that there are many influences over tradable asset prices, and while chart analysis can certainly help you identify entry and exit points and even set stop loss and take profit levels, technical analysis should not be your only source of insight. More about that later in the article. So let’s get started.
What are chart patterns?
Humans are hardwired to recognize patterns. From bunny-shaped clouds to Bitcoin hype cycles, we see connections everywhere, even in random chaos, but sometimes we need a little help to make sense of those patterns. Charts are very powerful tools for analysis and forecasting, and spotting chart patterns is easier than you think once you know what they look like.
By understanding these mathematical patterns and their implications, traders can develop a more comprehensive approach to trading. There are many different types of chart patterns that can be observed in the markets, and each one carries its own unique insights on optimizing your trade setups.
What are the most popular chart patterns used by traders?
Below are some of the most commonly used chart patterns that are used by traders when analyzing price action. Each of these patterns has a statistically significant forecast of what’s going to happen next. Let’s go through them.
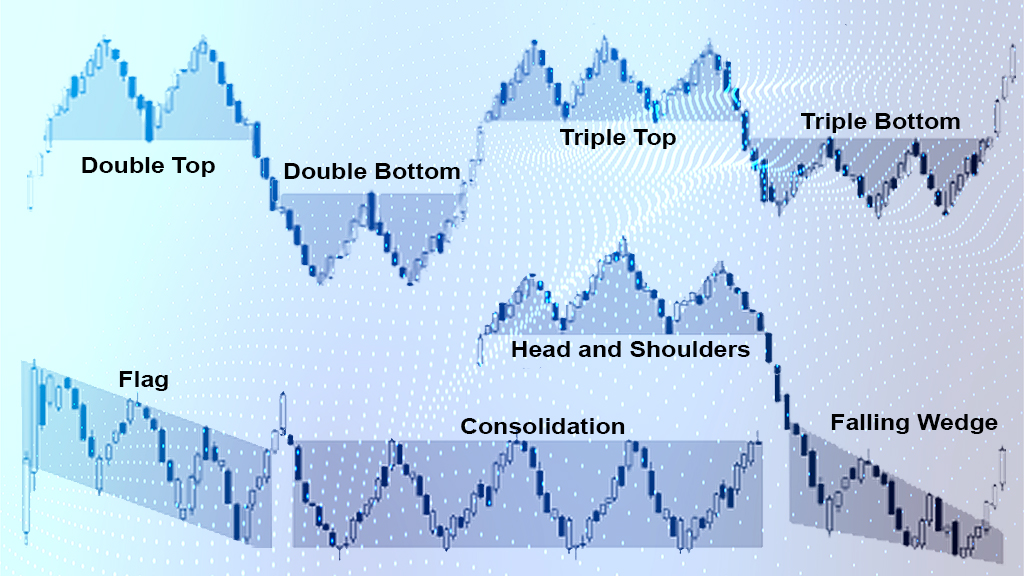
Double Top & Double Bottom: These patterns indicate potential trend reversals after a prolonged period of trending movement – usually in an uptrend or downtrend respectively. The double tops or bottoms occur at resistance (for uptrends) or support (for downtrends). The pattern suggests that a reversal may be brewing. Double tops are commonly seen after a massive rally loses momentum, signaling an overbought scenario and a pending reversal.
Note: Double tops are especially relevant for crypto traders. Be cautious when trading a double top, as it might lead to a triple top. Confirm a breakout before trading.
Consolidation: A consolidation chart pattern occurs when the price of an asset trades within a tight range for an extended period of time, creating consecutive triangles forming a rectangle shape on the chart. This pattern indicates that the market is indecisive, and can break out in either direction.
Note: It is important to set stop-loss orders to limit potential losses if the breakout fails to confirm the expected direction.
Flags: Flags can be both upward or downward. Flag patterns occur during periods where there’s a brief pause in the trend before continuing onwards. It suggests either a continuation or reversal, depending on which side of the pattern the breakout occurs.
Note: Bullish breakouts signify continuation while bearish breakouts suggest reversal.
Head & Shoulders: This is a reversal pattern where there is an abrupt surge followed by two pullbacks or ‘shoulders’ before dropping off again – creating the shape of a head with two shoulders.
Note: It usually indicates impending bearish trend reversals in long-term uptrends or bullish trend reversals in long-term downtrends.
Wedges: These indicate upcoming price movements within well-defined boundaries – either upwards (rising wedge) or downwards (falling wedge). Rising wedges usually form at the end of prolonged uptrends, indicating that prices could soon reverse direction. By understanding all of these patterns and forming expectations around them, traders can increase their chances of making profitable trades based on current market conditions while managing risk exposure more effectively.
Note: Past performance does not guarantee future results, but these chart patterns have years of data behind them, and the patterns you see indicate what usually happens next.
Tips for trading chart patterns better?
Trading chart patterns requires some self-discipline when executing trades. Below are some important considerations for any trader who wishes to use chart patterns for trading.
- Analyze conditions closely. Once appropriate trends have been identified, closely analyze current market conditions using multiple indicators so as to accurately interpret potential outcomes suggested by emerging chart patterns. Verify every assumption with another forecasting method.
- Add key levels monitoring to chart pattern trading. If you spot a chart pattern, consider analyzing overall trading volume, support & resistance levels (short-term and long-term), and review the overbought/oversold signals of the Stochastic. You’ll have better clarity regarding any bias amongst buyers/sellers within a given timeframe. Key factors can both support or destroy an assumption based on chart pattern analysis, so make sure you have consensus from all your preferred tools before investing.
- Develop risk management strategies. As with any kind of trading strategy, proper risk management should always be taken into consideration before entering any position. Determine stop loss orders to ensure losses remain minimal against increased volatility associated with active markets. Simply put, low equity in your account with high leverage on a volatile instrument is a recipe for a stop out. If you fund your account with limited equity, be moderate with leverage and choose your instruments and order sizes based on typical volatility ranges.
- Discipline yourself to do the research. Lastly, maintain discipline throughout the process. Avoid executing hastily, especially if market conditions have suddenly changed. The best practice is to stick to instruments that are most interesting for you, as you will need to stay informed on global influences that deeply affect those assets, such as political conflicts and central bank announcements.
In summary
To successfully trade chart patterns, traders should first correctly identify trends within their chosen asset class and analyze current market conditions using multiple indicators. Monitoring support & resistance levels closely and developing risk management strategies are also important considerations. Proper risk management should always be taken into consideration before entering any position, and traders should remain disciplined throughout the process. By understanding chart patterns and forming expectations around them, traders can increase their chances of making profitable trades while managing risk exposure more effectively.
But, as always, the markets make up an ecosystem, like a living creature. The factors that push and pull on an asset’s price are so numerous that market prices never behave the same way twice... sometimes, it doesn’t always rain on a cloudy day, so never risk all your equity at any given time.
Consider creating a trading budget. Limit your daily order totals to a percentage of your equity, calculate realistic profit levels and loss limits based on that percentage. If your analysis is good, your equity will rise and so will your daily trading budget. A bad run of trades will lower equity, and lower the daily budget, which lowers order sizes and overall risk.
Be patient, build slowly, and invest time as well as money. If you’re ready to try trading chart patterns, click the button to get instant access to trading charts, a demo account perfect for practicing your analysis, and fast deposits & withdrawals. If you’re mostly on-the-go, try the Exness Trade app. You’ll get all the advantageous features that Exness has created, and also get live news and notifications on top market movers.