HFM information and reviews
HFM
96%
Octa information and reviews
Octa
94%
FXCC information and reviews
FXCC
92%
FxPro information and reviews
FxPro
89%
FBS information and reviews
FBS
88%
Vantage information and reviews
Vantage
85%

Technical analysis: Beginners Guide


By definition, technical analysis is the forecasting of the future price action of an underlying financial asset based on its past price behaviour. Essentially, technical analysts believe that ‘history repeats itself’ and thus, a price chart is a technical analyst’s best friend.

Forex Market Trends

Technical analysis in CFD and Forex trading refers to the study of historical data and charts, in order for traders to make better-educated trades. It also represents the basis for various automated trading solutions, like the trading bots. Please note, past performance is not always a reliable guide to future performance.

There are 3 basic types of trends:

First, one must decide the type of trader/investor that they are. You must decide whether or not you hold positions for a long time or buy and sell fast. That decision will determine which trading charts you should be using. Day traders or those who jump in and out of positions fast, so they will use daily and intraday charts more than investors who buy and hold for longer period of times.

Practice your Technical Analysis on a Demo Account or open a Real Account if you’re ready to trade.

Support and Resistance Levels

A support level could be the previous low. The resistance level could be the previous day’s high point, or better known as a peak. After a resistance level has been broken, it will usually become a support level should the instrument you are trading decline again. When the instrument moves down and breaks the support, then this becomes the new low. Looking at it the other way, if the instrument moves higher through the resistance level, this becomes the new high.

Retracements

Retracements are percentages. During any given day (open to markets), the instrument you are watching or investing in, will usually retrace previous day’s trades. No matter if they are up or down. The most commonly used is fifty per cent. We also use one third, 38% and 2/3 levels.

Trend Lines

The easiest way to begin your analysis is by learning and applying trend lines. The first thing you must do is to draw a straight line that joins two points on your chart. To show a trend line that is increasing, connect two lows in a row and for a trend line that is decreasing, connect two straight peaks. You will note that usually, the market (price) will pull back towards a trend line before resuming a trend. When the price breaks a trend line, this is the end of a trend. The longer a trend line is, the more it has been tested and the more important it is. Note that a trend line becomes valid when the market touches it 3 times.

Moving Averages

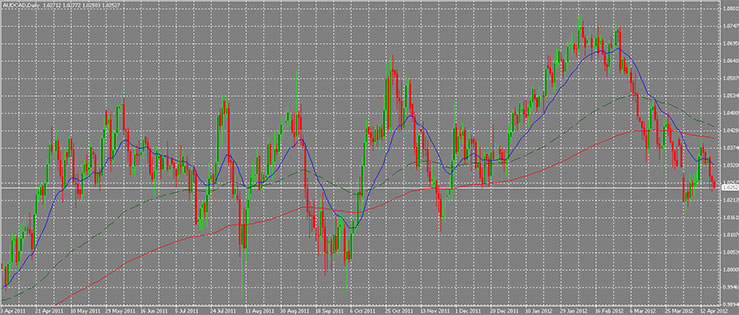
When you are looking for buy and sell signals, you look at moving averages. These averages will tell you if an existing trend is still in play. Beware: these do not predict trend changes, known as reversals. Traders usually use two moving averages. Movements above and below the 20 and 40-day averages are very popular. 5 and 20-day averages are very popular for those who trade quickly.
Oscillators

In order to identify overbought or oversold conditions in markets, oscillators are commonly used. These often warn a trader that a market has either risen or the market has fallen too far and a change is imminent. The Relative Strength Index or RSI and the Stochastics are the most popular oscillators a trader will use. These scales are from 0 to 100. The RSI: if the scale is over 70, this means it is overbought. If the scale is below 30, it is oversold. For Stochastics, the overbought level is 80, and the oversold level is 20.

Technical Analysis main FAQs

Does technical analysis really work?

Some people claim that there is no real relationship between the past movement of prices and the future movement of prices, making technical analysis invalid. However, it is easy to see that there are patterns in prices that can be used to predict market movements via technical analysis. There are several theories as to why this is true. One is that chart patterns display the action inherent in an auction market and thus provides predictive value. Another is that orders cluster around psychologically important levels. And some theorize that technical analysis is a form of self-fulfilment in that because many traders believe prices should reverse or continue at certain levels, they do.

What are the most important indicators in technical analysis?

This is going to depend in many ways on your trading style or strategy. A swing trader is likely to use different indicators compared with a scalper. Some analysts claim support and resistance are the most important levels since they are present as part of almost every technical indicator. Support levels and resistance levels become more “important” when they are confirmed by two or more different indicators, and using multiple indicators can provide very powerful trading strategies.

What is divergence in technical trading?

A divergence is when two indicators are not moving in the same direction even though they would usually be expected to do so. While this might create confusion, divergences are often indicators of a significant turning point in the market. For example, an oscillator may indicate weakness in the market even though price continues going higher. Divergence should be traded cautiously however since it can last for a long time and doesn’t typically provide timely signals for trading.


RELATED

A Pullback: Trade Against a Trend

Reading analytical outlooks on the price movements, you might be met with the word “pullback”. Many trading strategies are based on a pullback action...

What Are Order Blocks In Forex? Unraveling the Impact of Big Market Players

In the vast and intricate world of Forex trading, the presence of order blocks plays a crucial role in shaping market dynamics. Introduced by large financial institutions and central banks...

Fundamental and Technical Analysis

When it comes to analysing the financial markets there are two primary approaches used. One is technical analysis and the other is fundamental analysis, and they are quite...

Technical analysis: what separates the pros from the schmoes

In essence, technical analysis hinges on the study of past price movements and trends to predict future market developments. It first emerged as a tradition...

Bullish and Bearish Divergence: How to Catch a Signal

In analytics, there is a chance you’ll come across the term divergence. Divergence is one of the well-known market conditions that provide reliable signals...

Do you follow the Trend Lines?

Looking for ways to boost your technical analysis skills? Keep reading to see if trend lines are part of your trading strategy!

Technical Analysis: Directional Movement Index

Get ready for another instalment in our technical analysis educational series. After a multi-week hiatus, we’re back and ready to share even more knowledge

How to take your Forex trading to the next level

The Forex market is one of the most volatile and lucrative markets in the trading landscape. Worth an absolutely unfathomable $6.5+ trillion a day, it dwarfs...

Currency Strength Meter: Complete Guide

Any trader needs to define the direction of the currency pair. It is also important to remember that the market movement is defined by the strength and weakness...

ADX: Find the Strong Trend

In a wide variety of indicators that provide different signals, it's almost impossible to find the one that defines the trend's strength. It's vital to know whether the trend is stable or not, especially during...

The Ascending Triangle Pattern in Trading

Investors tend to use different tools to define the market direction. Technical indicators, candlesticks and chart patterns are all key to successful trading...

Ascending Triangle Pattern in Trading

Investors tend to use different tools to define market direction - technical indicators, candlestick, and chart patterns are all key to successful trading. There is a wide...

Best Forex Trading Patterns: Different Shapes, Common Signals

What do traders use to predict the price direction? Technical indicators, candlesticks, and of course, chart patterns. Overall, there are many trading patterns that occur...

Mastering The 50-Day Moving Average And Its Applications in 2023

In the ever-evolving realm of financial markets, gaining a deep understanding of various tools and indicators is essential for deciphering price trends and making informed decisions...

Bull Flag Pattern in Trading - Open Long Trades

In the world of technical indicators and patterns, finding a reliable, workable tool that would help you predict price direction is challenging. However, they exist...

What is Fundamental Analysis?

Understanding the core of an activity always makes it easier to do it regardless of how complicated it is. That is the case with fundamental analysis. While it may be done through...

Moving averages explained

Learn how to trade with one of the most popular Forex indicators - Moving Averages. In this article, we explain how to use moving averages as a technical analysis...

Elliott Waves for Forex Market Analysis

Studying the Forex market, it is easy to notice that the price movement on it occurs in waves. For decades many traders have been trying to find...

CFD Trading Simplified: Strategies for the Modern Online Trader

What if you could trade the global markets with more flexibility than ever before? With CFD trading, you can! Contracts for Difference (CFDs) stand out as powerful instruments within the Forex markets, providing the possibility to capitalize...

Mastering the Intricacies of Short-Term Trading Analysis

In the bustling corridors of the financial world, short-term trading stands out as a high-octane race, demanding lightning-fast reflexes, unwavering focus, and an adept understanding of market nuances...

MultiBank Group information and reviews
MultiBank Group
84%
XM information and reviews
XM
82%
FP Markets information and reviews
FP Markets
81%
FXTM information and reviews
FXTM
80%
AMarkets information and reviews
AMarkets
79%
BlackBull information and reviews
BlackBull
78%

© 2006-2024 Forex-Ratings.com

The usage of this website constitutes acceptance of the following legal information.
Any contracts of financial instruments offered to conclude bear high risks and may result in the full loss of the deposited funds. Prior to making transactions one should get acquainted with the risks to which they relate. All the information featured on the website (reviews, brokers' news, comments, analysis, quotes, forecasts or other information materials provided by Forex Ratings, as well as information provided by the partners), including graphical information about the forex companies, brokers and dealing desks, is intended solely for informational purposes, is not a means of advertising them, and doesn't imply direct instructions for investing. Forex Ratings shall not be liable for any loss, including unlimited loss of funds, which may arise directly or indirectly from the usage of this information. The editorial staff of the website does not bear any responsibility whatsoever for the content of the comments or reviews made by the site users about the forex companies. The entire responsibility for the contents rests with the commentators. Reprint of the materials is available only with the permission of the editorial staff.
We use cookies to improve your experience and to make your stay with us more comfortable. By using Forex-Ratings.com website you agree to the cookies policy.