HFM information and reviews
HFM
96%
Octa information and reviews
Octa
94%
FXCC information and reviews
FXCC
92%
FxPro information and reviews
FxPro
89%
FBS information and reviews
FBS
88%
Vantage information and reviews
Vantage
85%

Support and Resistance Levels: Comprehensive Overview and Practical Approaches


Written by Feng Zhou  Senior Market Analyst Feng Zhou

Support and resistance levels are paramount concepts, pivotal in navigating Forex and various financial markets. These levels underpin myriad trading strategies and form the foundational framework for numerous indicators and advisory bots in the trading ecosystem. To grasp these concepts thoroughly, we will delve deeper into their fundamental principles and real-world applications.

Fundamental Insights

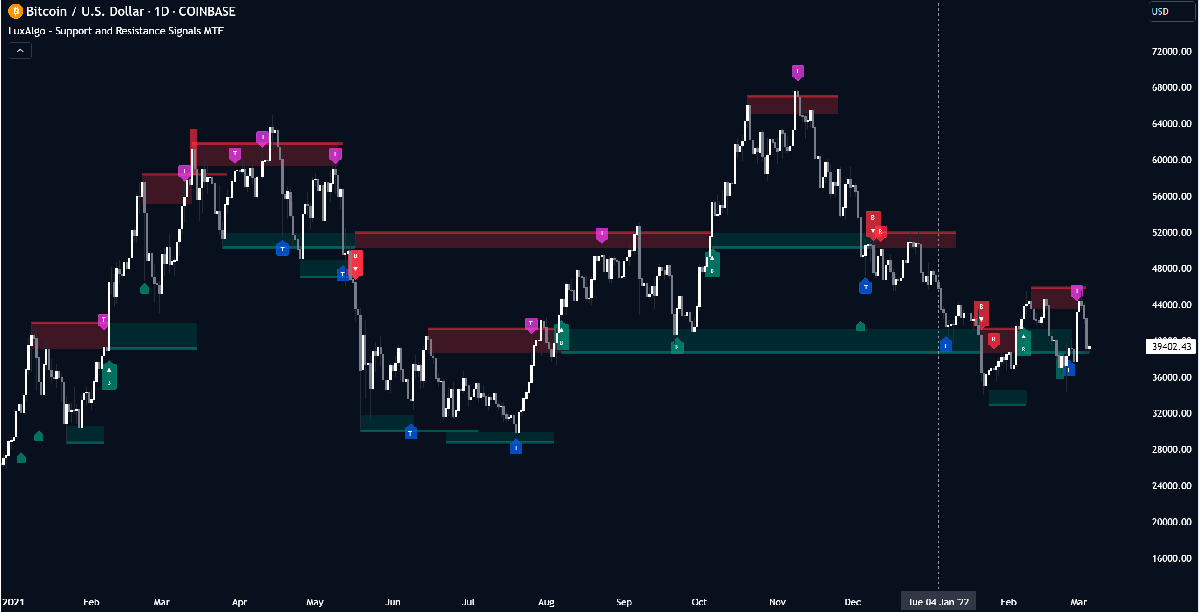
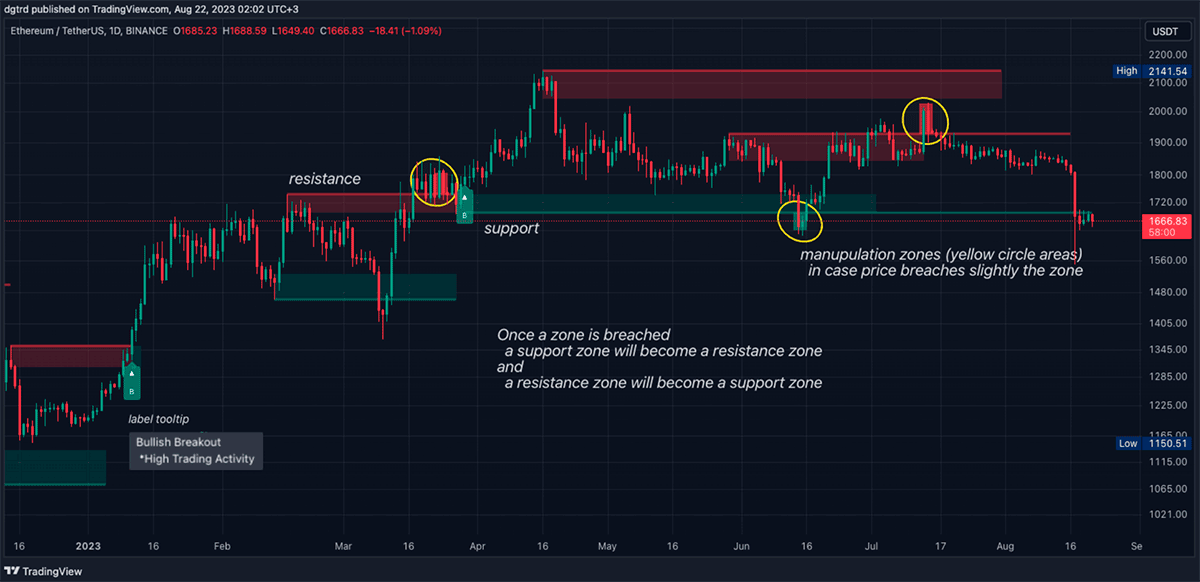
Support and resistance levels act as the critical barriers delineating the price range in which an asset oscillates. These barriers can be represented as horizontal, sloped, or curved lines. The asset's price trajectory often undergoes alterations upon interacting with these limits.

Analytical Precision and Probabilities

The verbiage ‘often’ and ‘may’ are intentionally used to emphasize that price reversals at these junctures aren’t absolute. Prices may pierce through support levels, descending further, or surpass resistance levels, ascending continuously. The likelihood of rebounds or breakthroughs classifies levels as robust or frail, elaborated further subsequently.

Support and Resistance Levels: Comprehensive Overview and Practical Approaches

Delineation: Zones versus Levels

Support and resistance are articulated through zones rather than precise levels, offering a nuanced understanding of price dynamics. For example, the EUR/USD pair could reverse around the 1.1500 mark, establishing a zone of fluctuation. These zones' breadth is influenced by the asset involved, the timeframe observed, and prevailing market volatility.

Real-world Illustrations

Currency Pairs:

Time Frames:

High volatility periods, often triggered by pivotal economic announcements, can escalate the width of the zones. These instances require traders to recalibrate their strategies dynamically, adapting to evolving market conditions.

Support and resistance are articulated through zones rather than precise levels, offering a nuanced understanding of price dynamics

Identifying Levels and Zones

The incorporation of psychological levels, high-volume trading points, and historical significance plays a crucial role in deciphering support and resistance points. Levels frequently tested and unbroken are deemed more reliable, serving as robust barricades against price movements in future scenarios.

Visual and Analytical Tools

Visual examination of price charts assists traders in pinpointing potential support and resistance points, with various graphical tools and specialized indicators like MetaTrader-4 aiding in constructing levels and channels effectively.

Deciphering Strength: Strong vs. Weak Levels

The robustness of a level is discerned through multiple confirmations, trading volume surges, historical relevance, and alignment with fundamental market indicators. Weak levels lack these reinforcing elements, often succumbing to price movements easily.

Employing Indicators for Enhanced Precision

Understanding and leveraging support and resistance levels can optimize trading strategies like "Buy Low, Sell High," "Breakout/Breakdown Trading," "Bounce Trading," and "False Breakout Strategy," enhancing overall trading acumen and efficacy.

Inference and Strategic Deployment

A profound comprehension of support and resistance levels and zones, coupled with meticulous application and integration with other analytical tools, forms a lucrative trading arsenal. However, traders must remain cognizant that these tools aren’t infallible and necessitate meticulous analysis, harmonization with diverse tools, and prudent risk management to mitigate uncertainties inherent in financial markets.

The intricate weave of theoretical knowledge and practical acumen can empower traders to navigate the tumultuous seas of trading with enhanced precision and confidence.


RELATED

Technical Analysis: Directional Movement Index

Get ready for another instalment in our technical analysis educational series. After a multi-week hiatus, we’re back and ready to share even more knowledge

Bullish and Bearish Divergence: How to Catch a Signal

In analytics, there is a chance you’ll come across the term divergence. Divergence is one of the well-known market conditions that provide reliable signals...

Beautiful Signals of the Butterfly Pattern

The butterfly pattern. It sounds nice, doesn't it? However, the real hides many difficulties for traders, especially for newbies. It's not a common trading tool...

Awesome Oscillator: Strategies & Uses

The awesome oscillator is a market momentum indicator that is used to define reversals and corrections of the price. It's one of the easiest but most effective trading tools...

What Is Crypto On-Chain Analysis? Definition & Meaning

Blockchain transaction data is publicly available, creating possibilities for data science and machine learning. All trading and investment activity can be extracted from the public...

Introduction to technical analysis in forex trading

Learn how traders use technical analysis to enhance their strategies and make informed trading decisions...

Fundamental Analysis Explained: A Trader’s Tools For Profitability

What is Fundamental Analysis? There are many ways to define fundamental analysis, but breaking it down to as simple terms as possible, it is the study of the underlying...

Three technical indicators you should know about

Seeing a list of indicators, you might easily get lost. This article will help you learn about 3 essential indicators that will help you define your trading strategy for any time period...

Leverage and Margin in Forex

Leverage and margin are the terms each trader starts with. The concept is simple, so even a beginner trader will catch on fast. However, there are pitfalls that may affect traders...

Assessing the US 100 Index: Dead Cat Bounce or True Bullish Turnaround?

The US 100 stock index (cash) has garnered significant attention in recent trading sessions. Notably, this past Wednesday, the index showcased an upward momentum...

How to Calculate the Value of One Point in Forex

A point is a very important concept for calculating possible profit or loss in financial markets. When conducting transactions, you need to clearly understand how much...

Choosing a Trading Instrument: How to Trade Indices

By now, you must be familiar with the names of the world's major stock indices: Dow Jones, S&P 500, NASDAQ, DAX30. But did you know that they...

The Ascending Triangle Pattern in Trading

Investors tend to use different tools to define the market direction. Technical indicators, candlesticks and chart patterns are all key to successful trading...

Japanese Candlestick Chart Analysis

The most convenient option for charting any asset on Forex is Japanese candles. The information content and the state of the market's data...

Technical Analysis Tools

Read on to find out about some of the most popular technical analysis tools that traders can use, such as Bollinger Bands, MACD, and RSI...

Read the markets: Technical & Fundamental analysis

One of the biggest concepts in trading relates to Market Analysis and how to read the markets. This includes both Fundamental analysis and Technical analysis...

ADX: Find the Strong Trend

In a wide variety of indicators that provide different signals, it's almost impossible to find the one that defines the trend's strength. It's vital to know whether the trend is stable or not, especially during...

What Is the Risk/Reward Ratio and How to Use It

The risk/reward ratio tells you how much risk you are taking for how much potential reward. Good traders and investors choose their bets very carefully. They look for the highest potential upside...

Price Gaps In Forex Trading: Types, Causes, And Strategies

Price gaps are a common phenomenon in forex trading, characterized by a significant difference between the closing and opening prices of an asset...

Moving averages explained

Learn how to trade with one of the most popular Forex indicators - Moving Averages. In this article, we explain how to use moving averages as a technical analysis...

MultiBank Group information and reviews
MultiBank Group
84%
XM information and reviews
XM
82%
FP Markets information and reviews
FP Markets
81%
FXTM information and reviews
FXTM
80%
AMarkets information and reviews
AMarkets
79%
BlackBull information and reviews
BlackBull
78%

© 2006-2024 Forex-Ratings.com

The usage of this website constitutes acceptance of the following legal information.
Any contracts of financial instruments offered to conclude bear high risks and may result in the full loss of the deposited funds. Prior to making transactions one should get acquainted with the risks to which they relate. All the information featured on the website (reviews, brokers' news, comments, analysis, quotes, forecasts or other information materials provided by Forex Ratings, as well as information provided by the partners), including graphical information about the forex companies, brokers and dealing desks, is intended solely for informational purposes, is not a means of advertising them, and doesn't imply direct instructions for investing. Forex Ratings shall not be liable for any loss, including unlimited loss of funds, which may arise directly or indirectly from the usage of this information. The editorial staff of the website does not bear any responsibility whatsoever for the content of the comments or reviews made by the site users about the forex companies. The entire responsibility for the contents rests with the commentators. Reprint of the materials is available only with the permission of the editorial staff.
We use cookies to improve your experience and to make your stay with us more comfortable. By using Forex-Ratings.com website you agree to the cookies policy.