


The world indexes have never fallen so quickly and strongly before. The financial crisis that has begun is unique for its trigger - it was caused by a virus COVID-19. The development of the crisis, the recession in the markets and in the economy does, is not provoked by the coronavirus itself, but by measures and the volume of incentives from central banks to combat it. Nevertheless, past crises were also unexpected and unique for most people. How did they proceed, what conclusions can be drawn from them, and how did investors earn on crisis volatility?
The end of the economic cycle, paradigm shift, recession - in other words, the crisis, have been awaited the past few years. Everything was fine for too long: for example, ten years without a recession with a growing stock market is a record for more than 100 years for the USA. The spread of the new coronavirus around the world and measures to combat the pandemic, as well as the collapse of the OPEC + deal in early March, became the “trigger” for a global shake-up.
Back in mid-February 2020, the markets renewed their highs, and then the S&P 500 fell by more than 27% in a month, the Russian RTS fell by 38%, the emerging markets index MSCI EM was down by 30%. Never before a market that is taking on new heights has pivoted down so abruptly.
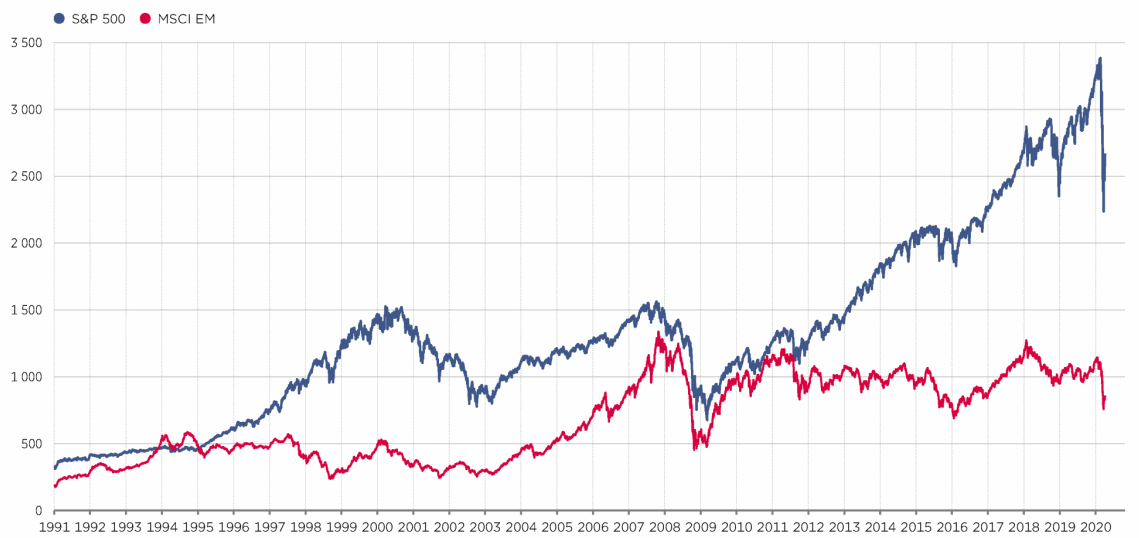
If you look at the dynamics of the S&P 500 and MSCI EM, we will see that the curve of both of these indexes, with the exception of volatility, was steadily rising in 2014-2015 due to geopolitical tensions. The average value of the US index over the past year amounted to 3133.85 points, its peak 3380.16 points was reached in mid-February, and already in March it showed a minimum of 2191.68 points. The last time the S&P 500 was at that level was more than four years ago.
So, in an environment where the economy is showing growth and indices are updating highs, there is a sharp reversal. And how was it before? How did the crises of 1998 and 2008 develop?
From bubble to bubble
After defeating inflation in the 1980s, the US Federal Reserve moved on to a policy of managing interest rates, which can be described with the phrase "from bubble to bubble". Watching the decline in inflation itself and inflation expectations, the Fed lowered the rate proactively at the first sign of a slowdown in the economy. After the correction phase, the regulator extremely carefully raised it back so as not to impede the growth of the economy and the market and not to make its actions cause a new crisis. This led to the fact that the rate in each next cycle since the 1980s on the approach to the next crisis was lower and lower.
The Federal Reserve aggressively reduced, non-aggressively raised, and each such exercise led to the fact that the rate in the end turned out to be lower. Therefore, the economic cycles after the 1980s follow a similar scenario: the Fed’s soft policy contributes not only to economic growth, but also to higher prices for financial assets.
The latter leads to distortions in the allocation of capital: separate markets or asset classes appear, which are characterized by an increase in leverage and an increase in the speculative component of the price. At some point, the speculative bubble ceases to inflate, risk appetite decreases, which causes a correction in the markets and a slowdown in economic growth. Correction in the markets and the intervention of the regulator eliminates the accumulated distortions in the allocation of capital, which creates the basis for growth in the next cycle.
1998
In 1996-1997 the US regulator began to cut its key rate to prevent a recession. This stimulus has been reflected in emerging markets. The crisis was foreshadowed by the collapse of the currencies of the Asian majors - South Korea, Singapore, Hong Kong and Taiwan. Asian countries pursued a policy of fixed exchange rates, which in addition to increasing predictability for exporters and long-term investors attracted short-term speculators. The devaluation of the yuan in 1994 made imports from China cheaper and more attractive than goods from its southern neighbors. At the same time, the Fed’s policy of strengthening the dollar and attracting investments cut off Asia from the traditional flow of “hot money” and hit export, as the national currencies of these countries were pegged to the US dollar.
The availability of loans led to Asian companies’ debt load, while return on investment became low. Western investors began to leave Asia, and this provoked a panic, as the business was afraid of a credit crisis. The authorities tried to stop the flight of capital by raising interest rates, but this was unsuccessful. Asian governments were forced to abandon fixed rates pegged to the US dollar and release their national currencies into free float. After that, currencies began to depreciate sharply. So, at the peak of the crisis in December 1997 - January 1998 Indonesian rupiah fell by 80% over the year, the currencies of Thailand and South Korea lost about half the value, Malaysia and the Philippines fell about 40%.
If in July 1997 the MSCI EM index reached the ceiling, in September 1998 it fell sharply by 58%.
2008
Each crisis has its own “bubbles”: in 2008, it was formed in the sector of American mortgage lending. Amid falling rates, demand for fixed-income instruments from investment funds and banks grew. At the same time, rising prices for residential real estate attracted a wide range of private investors to the market. A mechanism arose for issuing mortgage loans to less affluent borrowers who could not receive financing on standard terms in the framework of traditional government programs. Banks issuing such a non-standard mortgage repackaged their loan portfolios into new structural instruments that they sold to investment funds. The great popularity of these tools was facilitated by the fact that credit agencies were ready to assign fairly high credit ratings to them.
In the spring of 2008, Bear Stearns investment bank, at that time one of the largest in the market, which financed funds that bought secured debt, went bankrupt. By the summer of 2008, it turned out that these financial instruments were worth nothing, and a “trillion-dollar” hole had formed in the market. The fall of several major banks followed, for example, Lehman Brothers, and the deepest from 1920-1930 recession in the global economy. The widespread crisis has contributed to globalization, almost all countries in the world suffered.
At the end of 2007, the S&P 500 index peaked, then turned around and fell until March 2009 by 56% in a year and a half. The most severe decline occurred in mid-September - late November 2008, minus 36%. The S&P 500 returned to the pre-crisis peak only in 2013.
What happened in emerging markets? In 2007, the MSCI EM Index peaked. In the first quarter of 2008, there was a sharp correction, then the curve began to grow sharply - until June, after which it fell by a total of 62% until December.
The crisis caused a panic in the financial markets: many investors decided to sell risky mortgage bonds and unstable shares and invest in reliable assets. After the collapse of the financial derivative securities market, commodity futures speculation began, the global food crisis and rising oil prices.
Governments and central banks of developed countries launched a fight against the crisis on three fronts. Firstly, they ensured the functioning of the financial system, preventing the bankruptcy of the largest financial institutions. Secondly, in order to maintain low rates and stimulate the economy, a program of buying out assets from the market, the so-called "Quantitative easing", was launched, it was used in the United States until 2014. Thirdly, governments in different countries have introduced new regulations for banks and investment funds in order to increase the reliability and stability of the banking system and reduce incentives to create new “toxic” financial instruments. The soft policy of central banks allowed the economies of developed countries to recover; growth until March of this year continued for more than 10 years.
What strategies have been successful in past crises?
The most reliable strategy for an investor in a crisis is to wait for the volatility of markets in protective instruments. Traditionally, these were protective currencies, US dollar, Swiss franc, Japanese yen, and gold. The latter, for example, showed itself well in 2008, having slowly fallen by about 25% and recovering quite quickly, as soon as the stimulus measures of the Central Bank began to take effect.
“At times of crisis, the strategy is always the same: to buy excessively cheapened assets and later sell them at a higher price, which will be closer to the fundamental assessment. In 2009, there were many opportunities in the stock market, for example, the stake could be put on oil exporters who benefited from devaluation.”
“In the 1998 crisis and the 2008 crisis, the purchase of shares worked well after the devaluation ended. But the end of the devaluation becomes more or less clear only about a month after reaching the maximum on the dollar-euro market.”
“During the crisis of 2008-2009, it was possible to earn more than 100% per annum on Eurobonds of metallurgical companies only at the expense of price, not including coupon payments.”
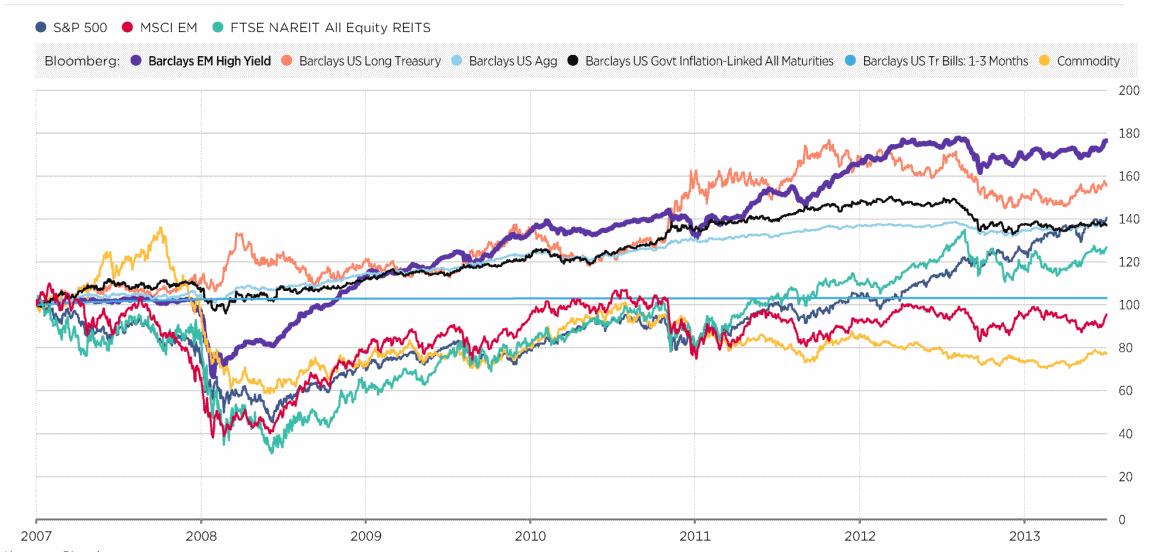
After the 2008 crisis, Emerging Markets High-Yield bonds were the first to recover. Their dynamics can be clearly seen on the chart below: debt securities of developing countries fell sharply by the end of 2008, but a year later they grew stronger than the American Treasuries.
The best tool for private investors in the crisis of 1998 and the crisis of 2008 was the dollar, just the currency.
What should be an investor’s portfolio in a crisis?
- Liquid. Buying something with an investment horizon of two to three years, we become hostages whether events will be guessed for this perspective.
- Without a leverage. The surest way to make money is to buy at a sale. The sure way to lose is to sell when you didn’t want to. When an investor has a leverage in the portfolio, there is a risk of margin call until the situation has returned to normal.
- Diversified by asset classes. In each phase of the cycle, the best will be its own asset class. It is impossible to guess exactly the change of one to the other, so you do not need to try to choose some best asset for a rebound. When the situation normalizes after correction, everything that survives, will increase in value.
- Diversified by company. Any company may not live to see the end of the crisis.
- With a clear risk. Diversification in itself, both by asset class and by company, does not replace portfolio control. Choose strategies with clear and acceptable sources of risk for you, it would be better to allocate assets in a way that meets the long-term strategy and goals of the investor.
Thinking over an asset purchase in a crisis and determining an approximate investment term, an investor may wonder how long it will take for a market to recover. Analysts at Morgan Stanley believe that global stocks typically need 15 months to recover from previous peaks after falling in a bear market. V-shaped restoration is a rare occurrence. It was observed only in the period 1932-1933 and lasted a year of the 17 episodes of the S&P 500 index.
The MSCI ACWI global stock index recovered on average over 15 months from a minimum. S&P 500, MSCI Europe and TOPIX indices recovered over 20 months. But the data scatter is very large. So, in 1998, MSCI ACWI recovered two months later, and after the global financial crisis of 2008 it recovered in only five years.
The coronavirus COVID-19 pandemic has become a key factor determining the dynamics of the global economy in 2020. Governments and regulators announce incentive measures one by one. The crisis is a time of opportunity for the investor, no matter how trite it may sound. Experience has shown that volatility, unpredictability, and panic pass, and new conditions provide an impetus for growth. Technical capabilities today allow to carry out operations not only in the local, but also in foreign markets without leaving home. To overcome the fear, that everyone has, when there is turbulence in the markets, not to make hasty emotional decisions and prudently approach the situation - these are the general recommendations by investors who have gone through several crises.


